
A code-compliant fixture count is the starting point—not proof that a concourse restroom can absorb halftime demand. Venue teams must translate attendance, zone distribution, arrival compression, station time, concurrency and planned redundancy into fixture banks that remain usable during the most demanding minutes of an event.
This guide provides a transparent planning method for architects, plumbing engineers, venue operators and facility managers. It does not replace the plumbing code adopted by the project jurisdiction or the authority having jurisdiction. Instead, it adds an operational demand layer to the required code analysis so the design team can test whether the proposed restroom layout will meet the owner’s queue, service and resilience objectives.
Use this article as a calculation companion to the central guide, “Stadium and Arena Restroom Fixtures: Designing for Halftime and Event-Peak Demand.”
Separate mandatory fixture counts from operational capacity
The project must first satisfy the adopted plumbing and building codes. Fixture quantities depend on matters such as occupancy classification, calculated occupant load, sex distribution assumptions allowed by the adopted code, fixture ratios, permitted substitutions, accessibility requirements and local amendments. Those minimums establish legal compliance. They do not automatically model how spectators are distributed among concourses or how quickly people arrive during a ten-to-fifteen-minute break.
Code analysis
Document occupant load, required water closets, urinals where permitted, lavatories, drinking facilities, service sinks and accessible fixtures under the locally adopted code.
Operational analysis
Model each restroom zone using expected attendance, user routing, peak-use share, arrival window, service time, availability and queue target.
Design reconciliation
Use the greater requirement and record assumptions so operators can compare actual event data with the design basis after opening.
Never reduce a code-required fixture count because a demand model predicts fewer stations. Operational calculations supplement the adopted code; they do not supersede it.
Start with attendance assigned to each restroom zone
Total venue capacity is too coarse for fixture-bank planning. Spectators do not distribute evenly across every restroom. Seat location, club access, vertical circulation, concessions, family amenities, security boundaries and event configuration all influence which facilities receive the largest surge.
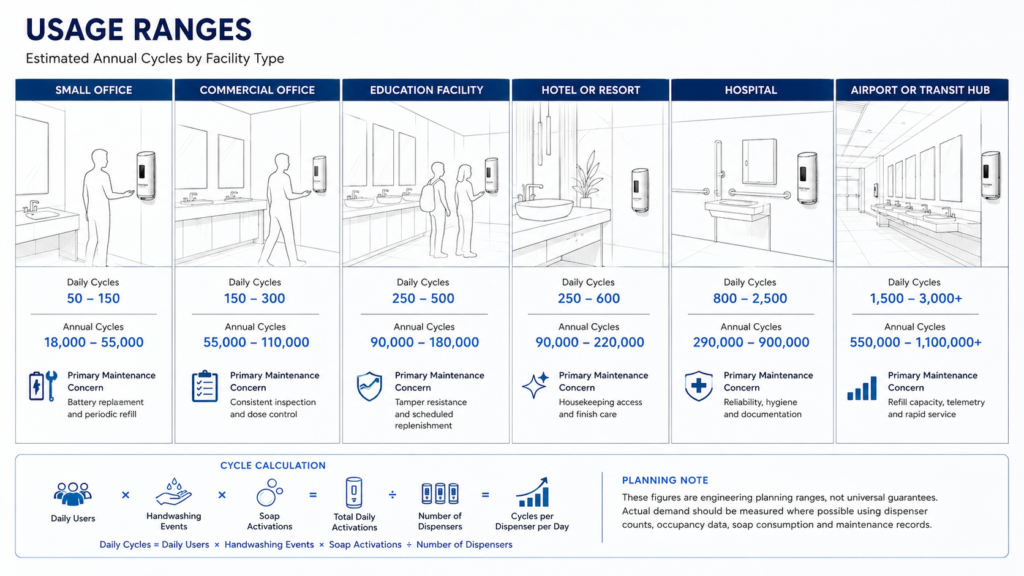
Arrivals per minute = zone attendance × peak-use share ÷ arrival-window minutesFor example, assume a concourse restroom group serves 2,400 spectators. If the planning team expects 24% of that zone to seek restroom service during a twelve-minute halftime window, the group receives approximately 48 arrivals per minute. That is a planning scenario—not a universal stadium percentage. The team should calibrate the peak-use share and arrival curve using comparable venues, ticketing patterns, observation, mobile-location analytics where permitted, or post-occupancy counts.
Convert demand into active washing stations
For the handwashing portion of the bank, the critical input is station occupancy time: the interval from one user taking control of a basin position until that station becomes practically available to the next user. It may include approach, sensor activation, wetting, soap use, rubbing and rinsing. The desired hygiene behavior and real user behavior are not always identical, so observation and mockup testing are valuable.
Active stations = arrivals per minute × average station time in minutes ÷ target utilizationIf a dedicated lavatory bank receives 30 users per minute, observed station occupancy averages 40 seconds (0.667 minute), and the design target limits utilization to 85%, the initial estimate is 23.5 active stations. Round upward, then add the project’s planned outage allowance. At 10% planned unavailability, the installed quantity becomes approximately 27 stations.
Utilization is deliberately kept below 100%. A bank designed at full theoretical utilization has no capacity to absorb uneven arrivals, slower users, accessibility needs, family groups, temporary blockages or minor equipment outages. The appropriate target is an owner decision supported by queue modeling—not a fixed product specification.


Use a zone worksheet instead of a single building-wide ratio
| Input | What to document | Why it changes the result |
|---|---|---|
| Zone population | Seats, suites, standing areas, staff and accessible/family demand assigned to the group | Establishes the population that can reasonably reach the bank. |
| Event mode | Sports, concert, convention, floor seating and premium-event configurations | Different schedules and seating plans redirect traffic. |
| Peak-use share | Percentage expected to seek service during the critical interval | Transforms attendance into demand. |
| Arrival distribution | Whether arrivals are uniform, front-loaded or concentrated near the end | Average arrivals can conceal a short queue-producing spike. |
| Station time | Observed or tested seconds per user at each fixture type | Converts demand into simultaneous station need. |
| Target utilization | Maximum planned utilization before queue risk becomes unacceptable | Provides operating headroom. |
| Availability factor | Expected percentage available during an event | Accounts for planned redundancy and temporary outages. |
| Adjacency | Nearby alternate restrooms and realistic wayfinding | Determines whether demand can be redistributed. |
Check the entire handwashing sequence—not only faucets
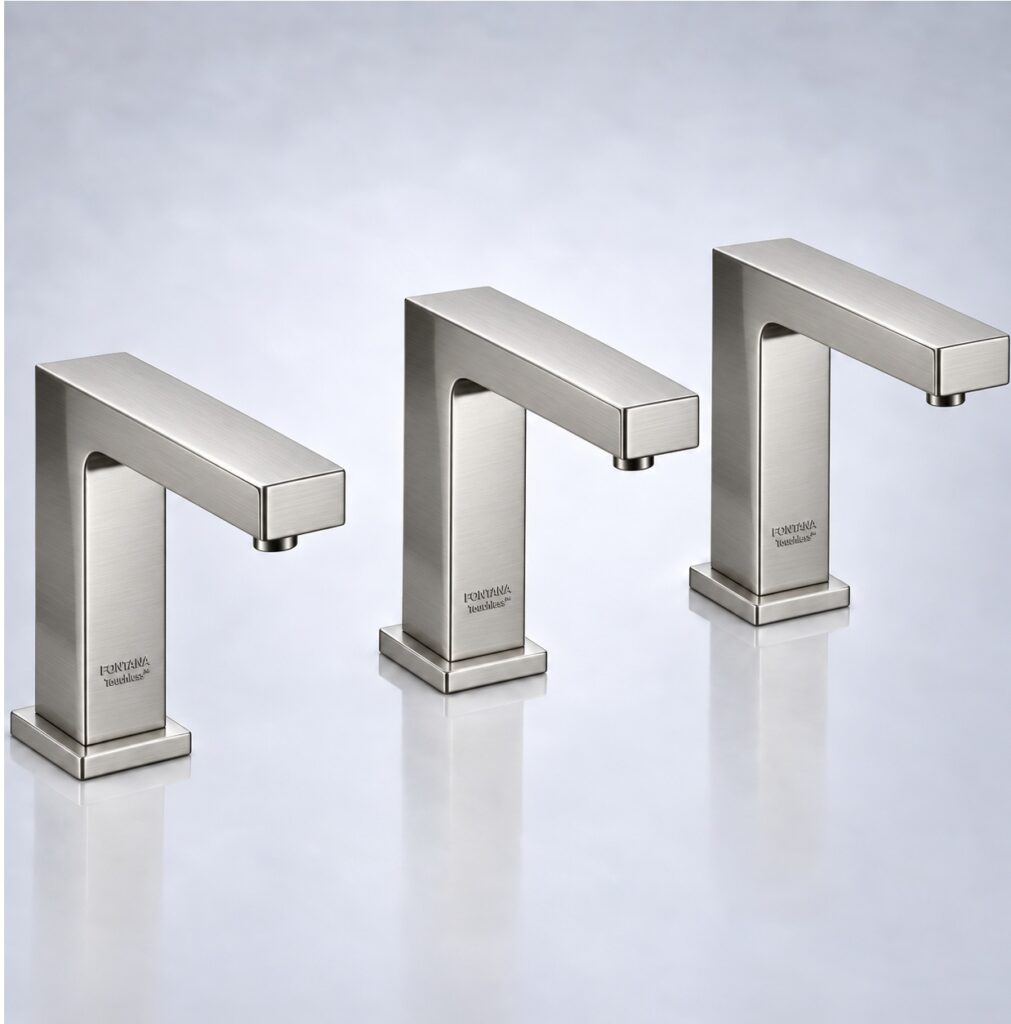
A calculated faucet count can still fail operationally if soap positions are unclear, dispensers are empty, dryers create cross-traffic or users must reverse direction. The bank should be studied as a sequence: approach, queue, fixture access, soap, water, drying and exit.
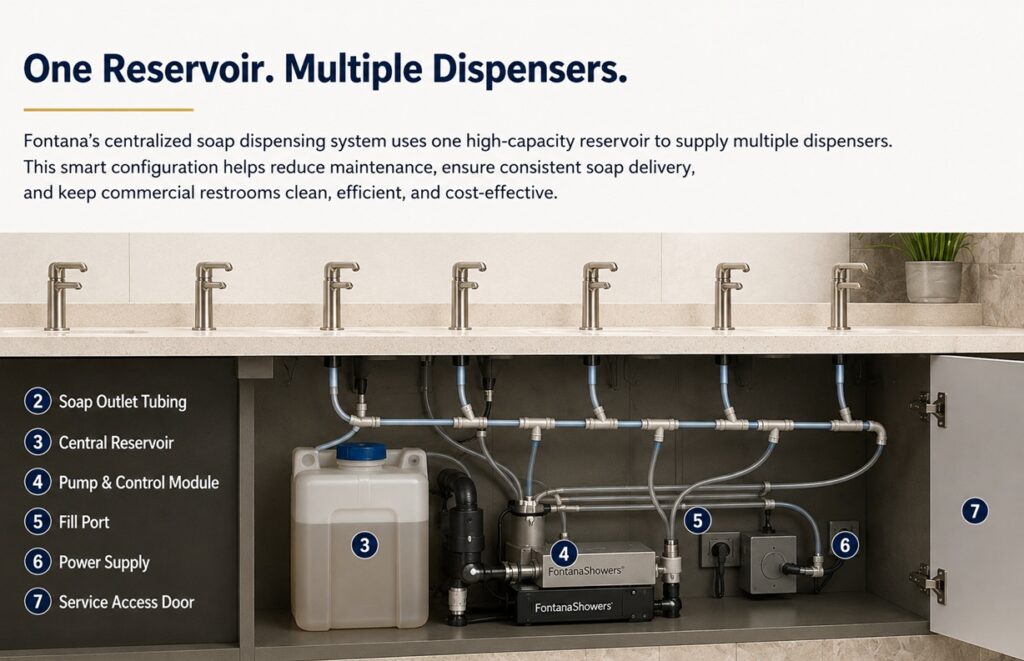
When soap and water are coordinated at each station, calculate soap capacity using projected activations and calibrated dose—not only reservoir volume. For centralized systems, check whether the selected reservoir, tubing topology and service plan support the number of connected dispensers and the event schedule. For dryers, evaluate manufacturer performance, electrical load, acoustic conditions, spacing and whether users waiting to dry obstruct incoming users.
Apply concurrency to water, drainage and power
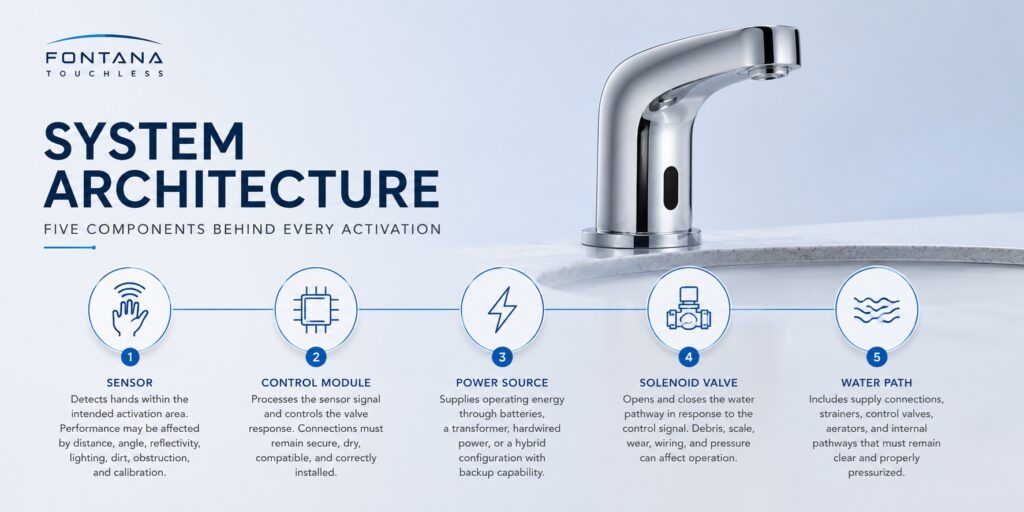
Fixture quantity creates simultaneous system demand. The plumbing engineer should test representative concurrency scenarios rather than simply multiplying every connected load by the number of fixtures or assuming that only a few stations will run. The appropriate diversity method depends on the adopted code, system type and engineering judgment.
- Available residual pressure at hydraulically remote banks
- Flow-control performance at near and remote stations
- Hot-water or tempered-water strategy where applicable
- Drainage response during simultaneous faucet and flush-valve operation
- Transformer and circuit loading for connected touchless fixtures
- Battery-backup access and replacement responsibility
- Isolation zones that do not disable an entire concourse
- Under-counter access without removing finished countertops
Plan redundancy as installed capacity and service zoning
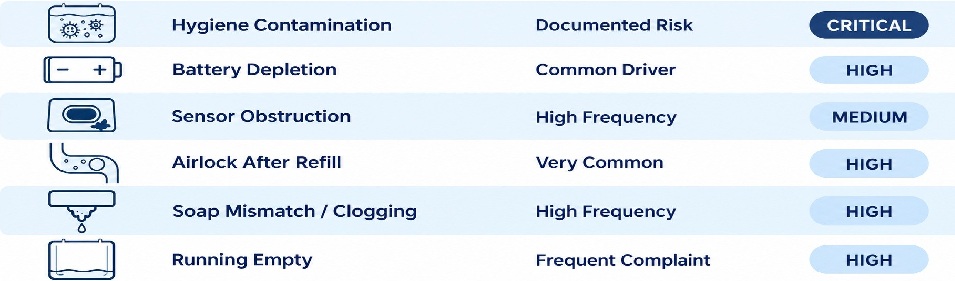
Redundancy is more useful when it is explicit. A project may add installed stations, divide banks into independently isolated plumbing and power zones, standardize replacement modules, provide alternate nearby restrooms or combine these strategies. A single upstream failure that removes a full bank can defeat a generous fixture count.
Station allowance
Increase installed positions so the operational target is still met with a defined percentage temporarily unavailable.
System segmentation
Arrange isolation, transformers, controls and soap distribution so one service event does not disable the entire room.
Recovery resources
Stock standardized modules, identify event technicians and define maximum acceptable time to restore a station.
Worked planning example
Assume a restroom group serves a seating zone of 3,000 spectators. The planning team selects a conservative event scenario in which 22% of the zone seeks restroom service during a twelve-minute break. The average arrival rate across the interval is 55 users per minute. Field observations suggest that 55% of those users proceed through the modeled lavatory bank, producing approximately 30.25 handwashing arrivals per minute.
| Zone attendance | 3,000 spectators |
|---|---|
| Peak-use share | 22% during the critical break |
| Arrival window | 12 minutes |
| Restroom arrivals | 3,000 × 0.22 ÷ 12 = 55 per minute |
| Share using modeled lavatory bank | 55% |
| Handwashing arrivals | 55 × 0.55 = 30.25 per minute |
| Observed station time | 40 seconds, or 0.667 minute |
| Target utilization | 85% |
| Active stations | 30.25 × 0.667 ÷ 0.85 = 23.73; round to 24 |
| Planned availability | 90% |
| Installed planning quantity | 24 ÷ 0.90 = 26.67; round to 27 |
This result is only the lavatory operational estimate for the stated assumptions. The final design must also satisfy the locally adopted plumbing code, accessibility requirements, actual restroom type, sex distribution methodology, basin layout, circulation, queue analysis, water/drainage/power calculations and owner criteria. Sensitivity testing should increase the peak-use share, shorten the arrival window and extend station time to identify how quickly the proposed bank becomes overloaded.
Validate the model with mockups and post-occupancy counts
Calculations should lead to testing. Build a representative station or bank segment using the scheduled faucet, basin, soap system, outlet and counter geometry. Measure first-attempt activation, station occupancy time, splash, cross-activation, user reach and service access. During commissioning, repeat testing under simultaneous use and verify remote pressure, detection settings, power transition, automatic shutoff and isolation.
After opening, count arrivals and departures during several event types. Record queue length at short intervals, fixture downtime, soap depletion, cleaning interventions and user-routing problems. Update the planning model so later phases and future projects use evidence from the venue rather than generic assumptions.
Fixture-bank planning checklist
- Confirm the locally adopted plumbing and building codes.
- Document code-required fixture quantities separately.
- Divide the venue into realistic restroom service zones.
- Model sports, concert and special-event configurations.
- Estimate peak-use share and arrival-window shape.
- Measure representative station occupancy time.
- Select an explicit utilization target.
- Add a documented availability or outage allowance.
- Check accessible and family restroom demand independently.
- Coordinate soap, drying, circulation and exit paths.
- Test water, drainage and power concurrency.
- Segment banks for practical isolation and recovery.
- Build and time a representative mockup.
- Commission under simultaneous operation.
- Collect post-occupancy event data and recalibrate.
Connect the calculation to the complete venue specification
Fixture-bank quantities should be developed together with sensing, basin coordination, soap capacity, power, accessibility, commissioning and event-day maintenance. Continue through the related-resource explorer below or review specification-ready commercial touchless venue systems.